The Hidden Custom Metric to Better Understand Your PMax Campaign
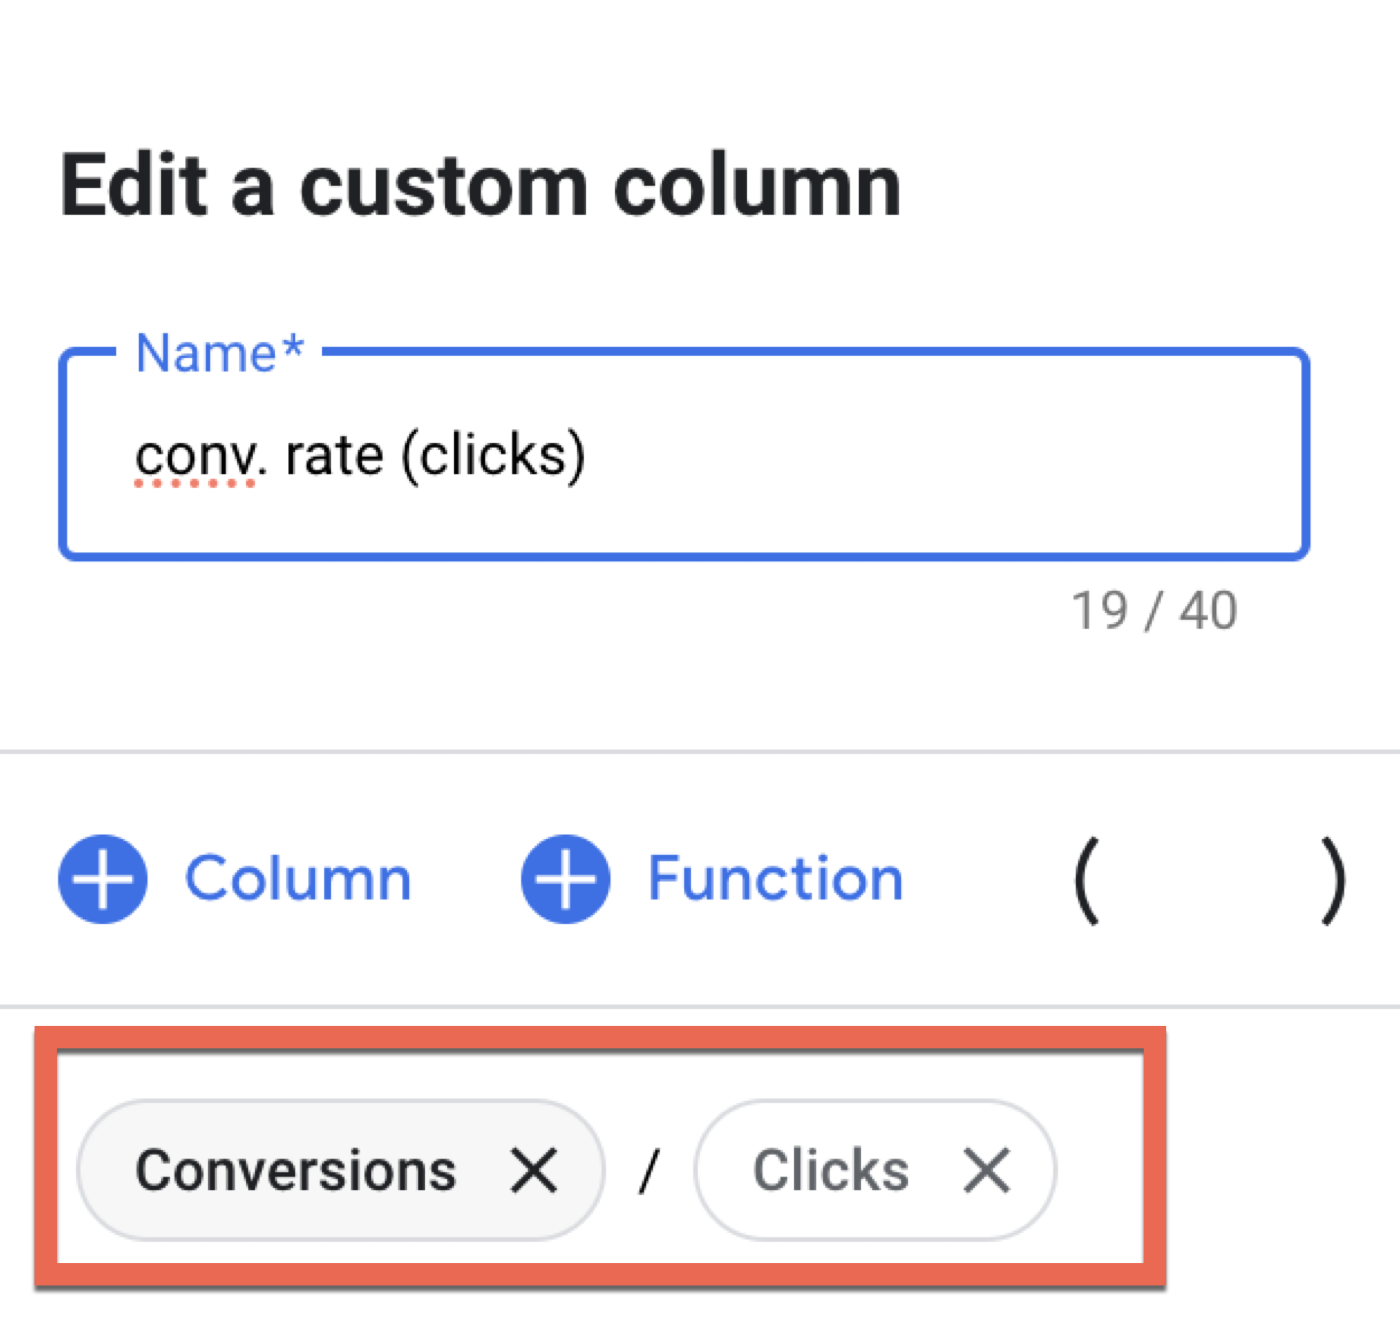
Table of Contents
Performance Max campaigns are like a black-box
Google’s Performance Max campaigns are like a black box –
you can’t really know what’s going on inside
but with a few simple techniques
you can absolutely analyze them and optimize their performance.
Here’s a story for you:
In one of the campaigns I manage, I wanted to generate more leads
so, I expanded the targeting of the PMax campaign
and a few days later, I noticed a drop in the conversion rate:
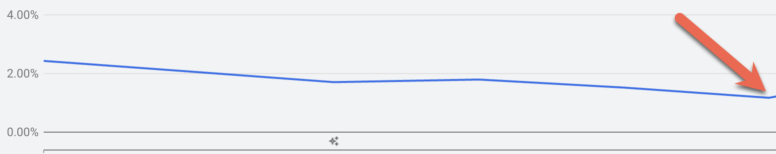
Why did the conversion rate drop?
(The drop started small at first, but that’s related to the product’s seasonality)
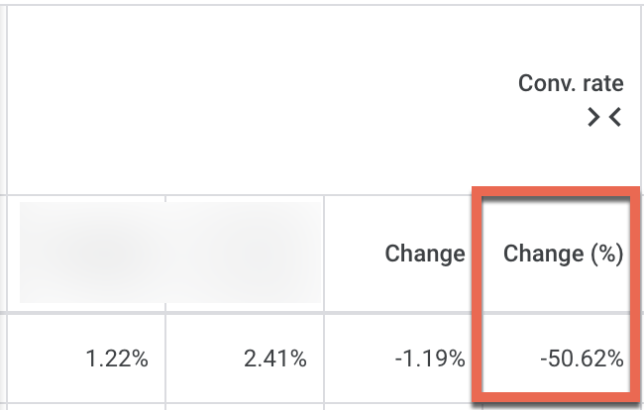
In any case, during the period after the change
the conversion rate dropped by 50%.
At that point, I had three options:
- Decide that “the new targeting doesn’t work” and remove it.
- Blindly trust PMax to relearn and improve the conversion rate.
- Analyze the data in depth and make smart decisions.
The problem with PMax is that it’s not easy to know where the ads appeared
yes, there is a placements report that provides some information
but it’s not like Search, Display, or YouTube
where you can exactly see where the ads appeared and understand the exact context.
Therefore, you need to work smart and infer insights from the data
so I checked and saw that impressions had tripled, and the CTR dropped by 50%
I estimated that the targeting change I made
caused the campaign to shift budgets to Display
where, naturally, there are significantly more impressions than Search
and the CTR is lower due to banner-blindness.
However, my CPC only increased by 5%
and usually, when budgets shift to Display
I would expect the CPC to drop significantly
so I didn’t dismiss this hypothesis
but I flagged it with an asterisk
Then I asked myself: does the drop in the conversion rate
really mean that visitors who landed on the page converted 50% less?
And the answer is—absolutely not!
Google calculates the conversion rate not as “conversions out of total clicks” but as “conversions out of total interactions”.
An interaction can be a click on the ad but also a video view
and if someone watched a video but didn’t convert
I definitely don’t want to interpret that as “my conversion rate dropped.”
The hidden custom metric
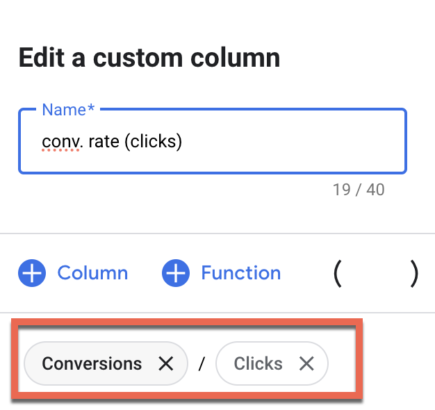
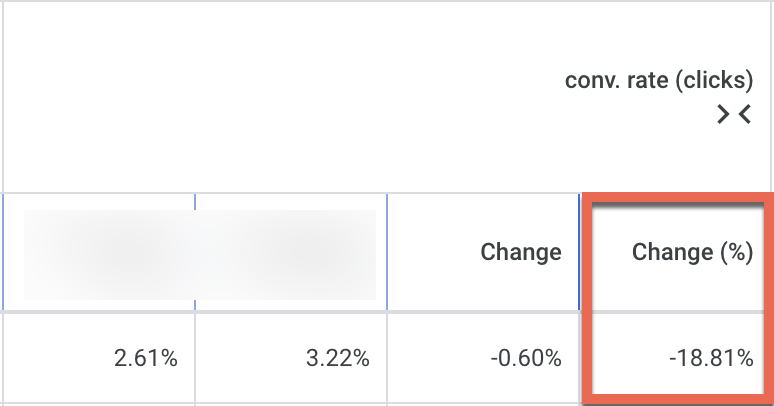
So, I created a custom column with a custom metric
that shows the conversion rate as “conversions out of clicks“:
And surprise—suddenly my conversion rate
didn’t drop by 50%, but only by 18.81%!
With the new data
it’s much easier for me to answer the question:
“Is the new audience brought in by the updated targeting converting less
or should I just let PMax optimize itself?”
Because an 18.81% drop can definitely improve through system learning
and I can anticipate that I won’t lose much money until that happens.
On the other hand, if the drop had really been 50%
it would have been much harder for me to accept
even if I decided to give the campaign learning time
I would know to expect a longer period of losses.
That’s it for today! :)
Remember – always try to understand the story behind the numbers.